If VIS wants rigor, it can’t be incentivising crackpot science.
I know the title is provocative, but hear me out; I say this as someone who has dabbled in a bit of crackpottery myself. Usually I keep my unpopular opinions to myself, but I feel this one might actually offer value. Mostly because I have, once again, read an opinion piece by a senior VIS researcher who is crashing out about the lack of a formal theory in VIS and complaining about the fact that everyone is just kind of doing stuff. For examples of what I am talking about, see this paper, this paper, and literally last year’s keynote for IEEE VIS. I want to hedge this by saying that my main areas are visual inference, uncertainty visualisation, visualisation information theory, and statistics. So, if you are reading this, and you are thinking “well this doesn’t happen in MY VIS area” then I’m happy for you; you may go on your merry way.
I promise I am not a hater
To show that I am not just a hater, I want to start by mentioning three VIS things that I like (there are others, but I don’t have all day people). You can skip this if you are already assured of my hater (or non-hater) status.
- I think the product plots use of measure theory to connect the geometry and probability of graphics is neat.
- I think ggdist is a nice description of mark design for univariate distributions.
- I like a lot of Danielle Albers Szafir’s colour stuff
Ok that’s enough of that.
My personal experience at IEEE VIS 2023
Around the start of the second year of my PhD, I was quite involved in the VIS community. Most of my Zotero was filled with IEEE TVCG papers; I picked VIS papers for my research discussions; and I went to VIS 2023 in Melbourne, where I presented an early version of my PhD research as a poster. At this point, my supervisors, who were more statisticis than VIS, were not really keen on my research, but they couldn’t really explain to me what was wrong with it. I was working on a taxonomy that described the information of uncertainty visualisations. From my perspective, my research was quite similar to the research I enjoyed reading in VIS conference proceedings and journals, so I didn’t see what was wrong with it. However, while at VIS in 2023, I started to understand my supervisors’ perspectives and develop some concerns of my own.
Now, I need to give a little context for the issues I ran into at VIS 2023. By training, I am a statistician (with a little bit of economics). That is to say, I approach graphics from a statistical theory perspective. However, I actually think this is a strength for one key reason: data visualisations are literally summaries of data. They are therefore statistics, and their information theory falls under the purview of statistics. The only people who I have found to disagree with this statement are those who want to work on statistical graphics, but are uninterested in learning any statistics, which is going to be an ongoing issue in this post. This drawing is the best explanation I can give for how information must travel in a visual inference task (like it is literally just the fundamental concept of information theory).
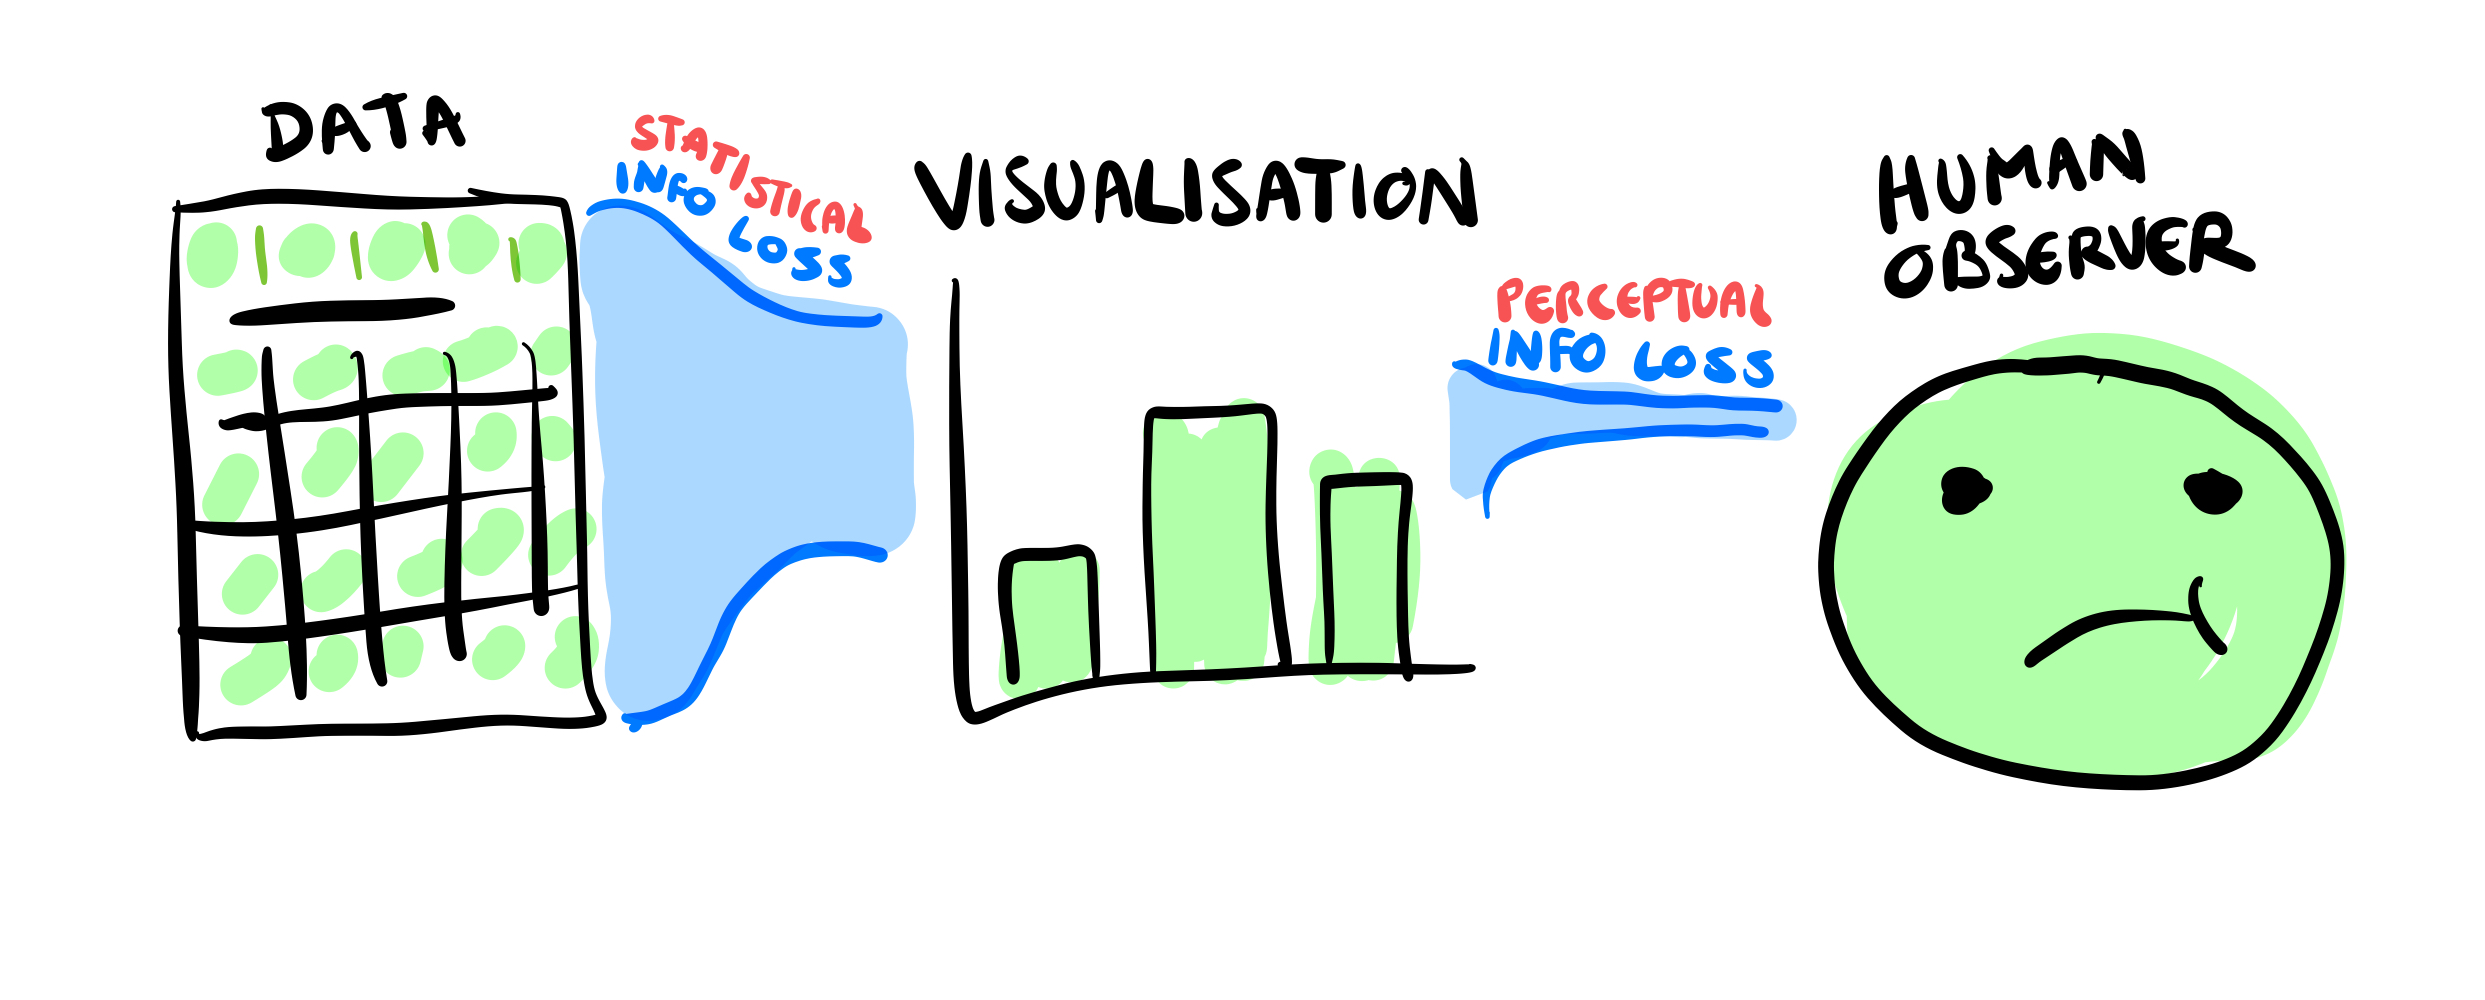
This is a very straightforward point: I cannot visualise information that is not in my data, and I cannot see information that is not visualised. At best, the information passing between layers can be equivalent to the stage before, but never more. So the potential amount of information in the visualisation should follow this principle: \(data \subseteq visualisation \subseteq observer\). If we ask someone to perform a specific task, we are indirectly asking them to compute a statistic, \(\omega\), which will have an associated sufficient statistic. A sufficient statistic is a function of a sample that captures all the information about \(\omega\). Therefore, at the very minimum, for a participant to correctly answer a question about a graphic, the graphic must contain (in some form) the sufficient statistic. If you show someone a graphic which does not contain sufficient statistical information it is mathematically impossible to answer the question correctly. No amount of human perception studies will change this fact.
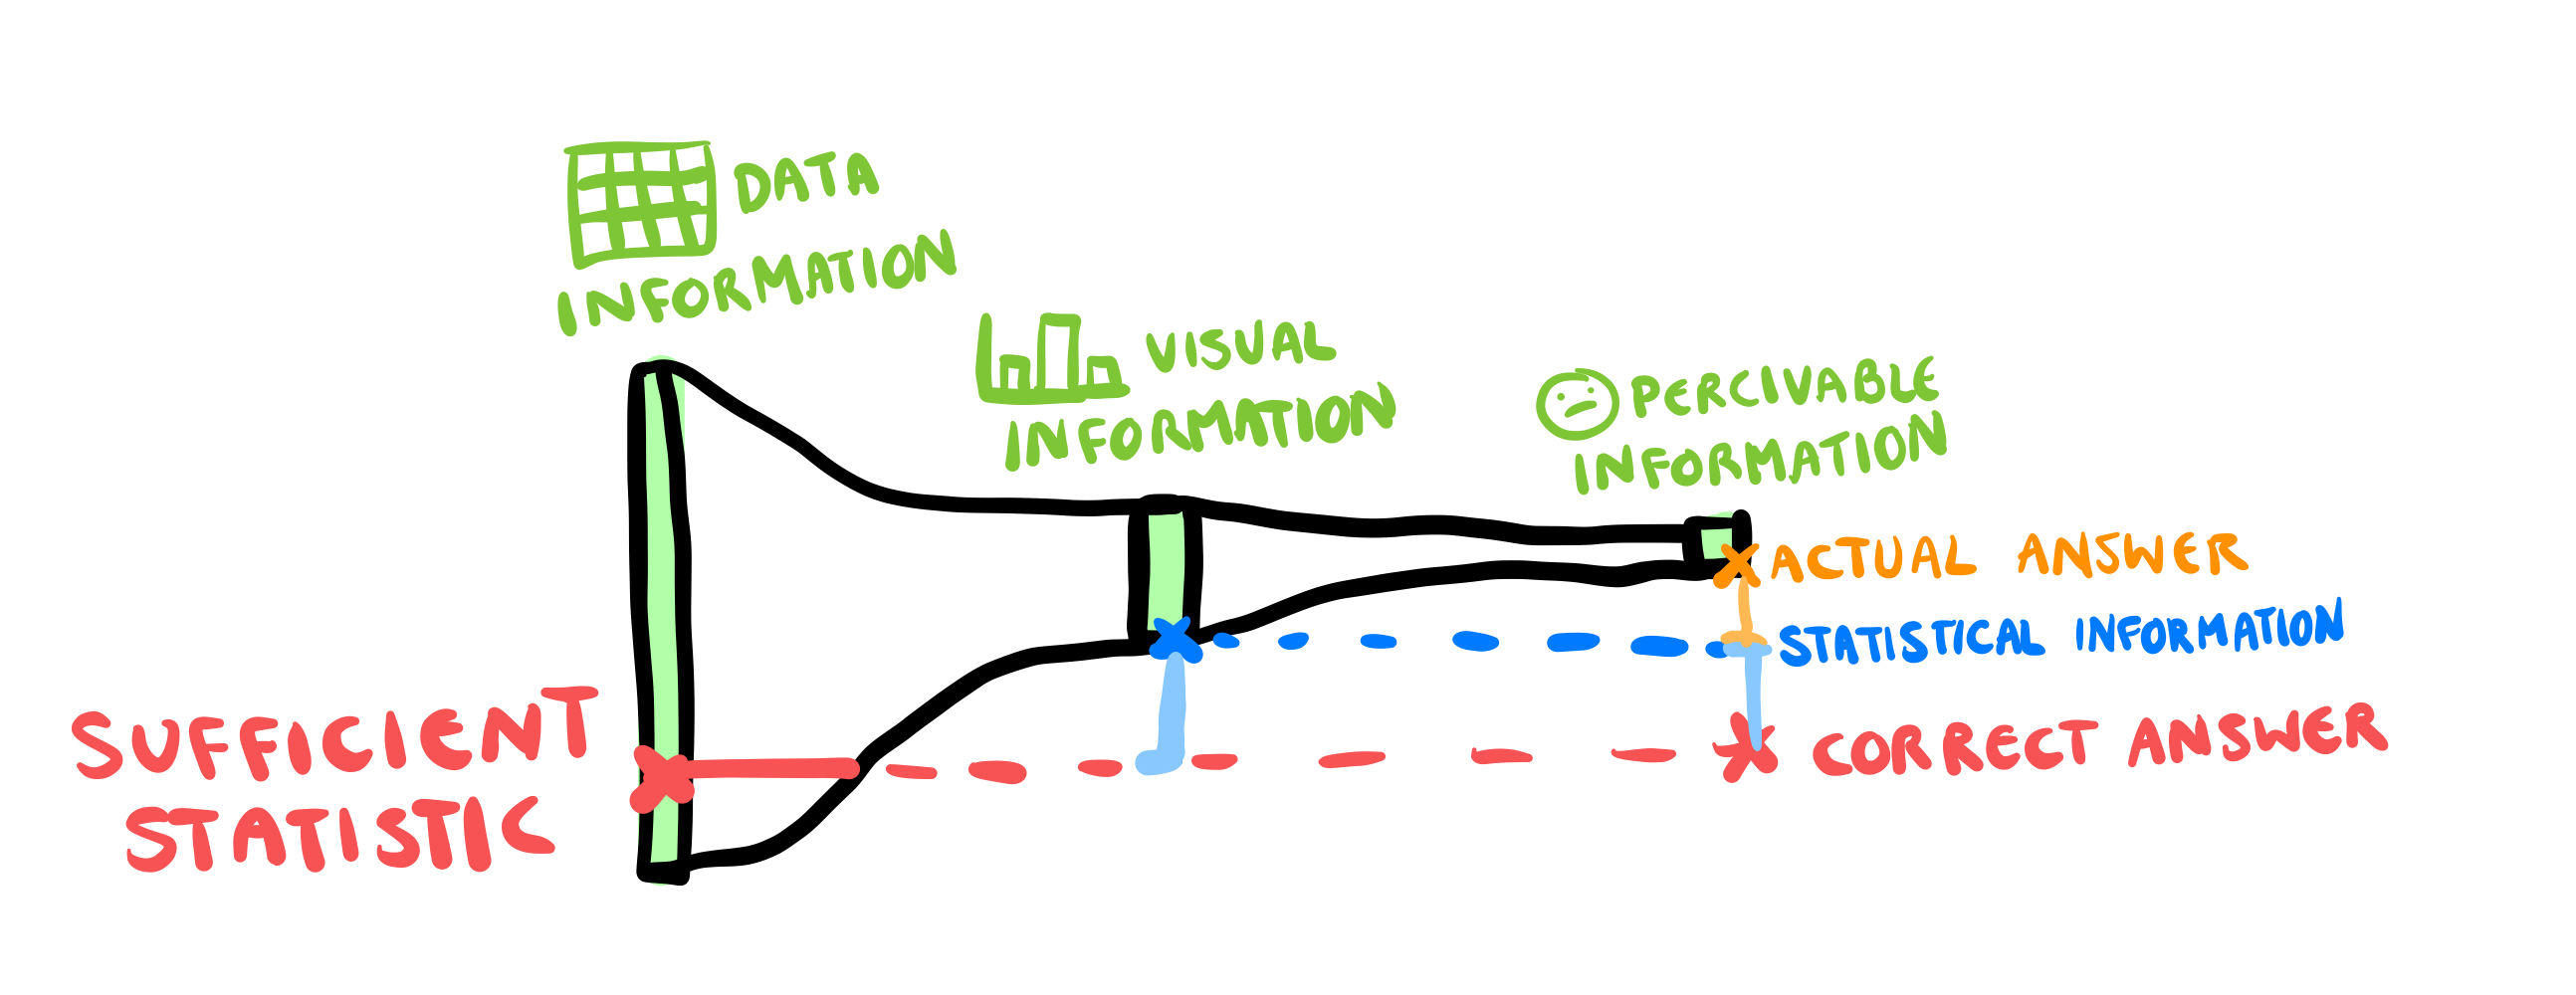
Why is this relevant to VIS 2023? Well, at VIS, I noticed several talks in which the authors compared two different plots on a single task. However, in one plot, the sufficient statistic was intact, while in the other, it had been destroyed. The information required to answer their question was gone before any human looked at the plot. We didn’t need a perceptual experiment to work that out. Additionally, I started to find that computational distance to the sufficient statistic was a near-perfect predictor of every single task-based experiment. Because the authors did not consider the statistical information in the plot, they were constantly attributing the statistical information loss to the human observer, with statements like “our results show that people are unable to extract the mean from a CDF plot”.
So, since it’s a conference, and I am a young and enthusiastic PhD student, I decided to try and talk to some of the authors about this observation. I am not an animal so I didn’t raise my “it’s more of a comment than a question” during Q&A, but I did stop the authors after their session to discuss how sufficient statistics could inform their stimuli design. To say that the responses I got from VIS academics were overwhelmingly rude and dismissive is an understatement.
One author stared at me, didn’t answer my question, looked at my name badge, and said with a southern drawl “Mooonaaaaash University” before sniggering and saying “where even is that?” and then turning away to talk to someone else. Another attendee said I was “trying to use statistics to gatekeep visualisation research” and asking people to check if their plot had sufficient statistical information was “an unfair burden to put on VIS researchers”. Another academic said that, as an “expert”, I might read plots that way, “but VIS is interested in understanding how the average person reads plots”, so my theory of information was not useful.
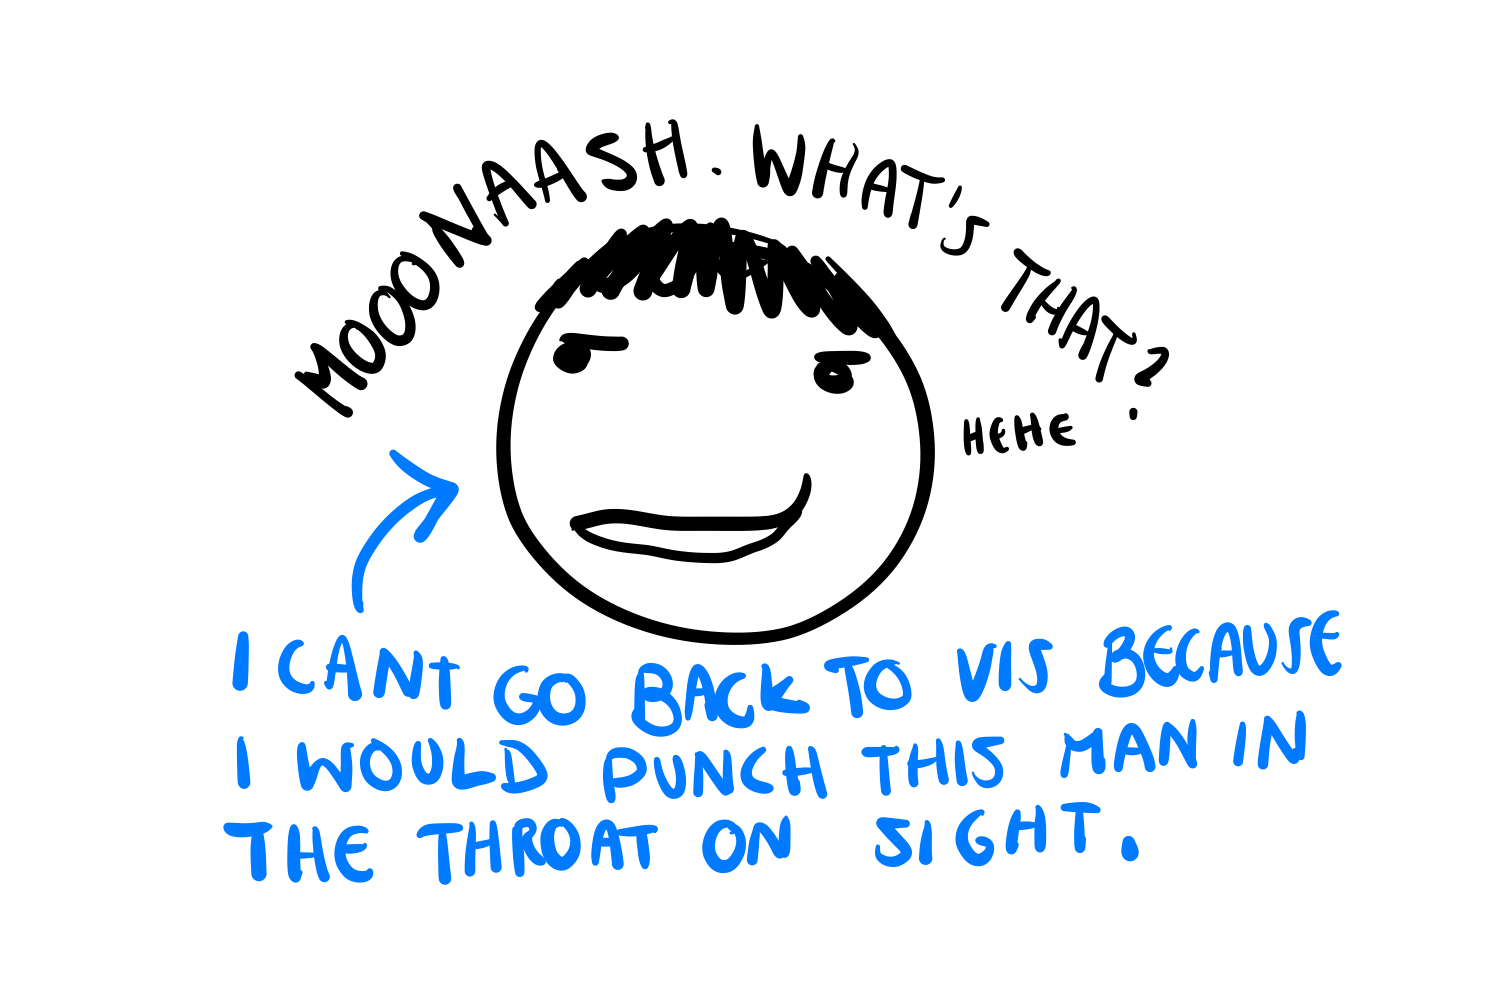
While the rudeness was certainly a problem, the thing that was more concerning to me was the way that everyone was acting as though I had shared an opinion, rather than a mathematical fact. To me, ignoring sufficient statistics in VIS felt like a statistician ignoring the fact that 1+1=2. The entire experience was bizarre, and ultimately soured my attitude to the VIS for the rest of my PhD.
Oh no, am I doing crackpot science?
It was around this time that I saw this video (and also this video) on crackpot science. The video suggests four markers of a crackpot theory:
- The work addresses the biggest problems in the field
- It is lacking in mathematical rigor, experimental evidence, etc.
- When their ideas are rejected, they respond with anger and claim the scientific establishment has blacklisted them
- The theories are not recognisable as theories for that field.
Upon seeing this list, I realised why my supervisors (and panel) were not fans of my research. My PhD work had a lot of the markers of a crackpot theory. To translate the crackpot theory to the context of my particular research question, the issue was that:
- Trying to describe the information theory of uncertainty visualisation was way too vague and broad. In an effort to be generalisable and far-reaching, the theory said nothing.
- By using a taxonomy, I was avoiding mathematical rigor, and designing a theory that was not verifiable or testable in any capacity.
- I was not being receptive to my supervisors concerns about the research.
- I was not using the established language or theories of statistics, so my research was not recognisable as a statistics theory.

Now, I wasn’t running around screaming about being Einstein (that would come later), but there were enough similarities that I started looking more critically at my research. After all, if I really believed my work was different to crackpot shit, I shouldn’t be averse to proving it. It turns out, proving it was much harder than just offering a vague taxonomy, but it also made the work more valuable. Through the mathematical formalisation, my theory went from a vague idea to something that could be tested and falsified (if wrong). What was involved in this process? Specifically I had to:
Drop the taxonomy approach and formalise my ideas in mathematical statistics, which required me to: a. Argue that visualisations should be considered continuous functions from the data space to the visual space. b. Define a metric for the visual space, which can be used to define the space of visual graphics as a metric space. c. Use the metric space to define convergence of statistical graphics. d. Use convergence to translate continuous mapping theorem to uncertainty visualisations and show their ideal behaviour.
Translate this formal theory into a testable hypothesis that could predict the outcome of an experiment and be falsified by a negative result. - A consequence of the mathematical formalisation is that a visual signal should be harder to see as the uncertainty increases.
Actually test this hypothesis with a proper human experiment.
At every stage, I asked myself what a crackpot would do, and then tried to make sure I did the opposite. Ultimately, this approach had the extra benefit of leading to a flexible and generalised uncertainty visualisation system that can make an uncertain version of any plot, called ggdibbler. A result which is clearly of interest to the VIS community, since two papers from this year - i.e. 1 and 2 - are a subset of what can be done with this theory and software.
OK hear me out, I think VIS has a little bit of crackpot stuff too
When I started applying the “crackpot checklist” to my research, I started getting more interest from statisticians and less interest from VIS. Unlike the VIS community who were overwhelmingly dismissive of my comments about mathematical rigor, statisticians were enthusiastic about it. Some might argue that I am being pedantic about the distinction between statistical graphics and VIS, but I would disagree. To start with, nobody in statistics has called me a gatekeeper who went to a shit university (well, not yet). But the other main differences are that (1) statistical graphics builds on a well-established theoretical foundation (statistics), and (2) the primary reviewers for statistical graphics papers are statisticians who can tell if there is something wrong with the statistical logic. If you ignore these differences, you end up with something that starts to look a LITTLE bit like crackpot science. So, lets look at that crackpot list again and discuss each one in relation to VIS (ignoring #3 because we are talking about a whole field).
Note: I am about to use recent bluesky posts from Matt Kay to make this point, but this is not an attack on Matt in particular. The interaction with him is what inspired me to finally make this blog post. Tamara Muzner also liked his response, so I think it is fair to say this comment represents the opinion of at least TWO academics in VIS research.
1. The work addresses the biggest problems in the field
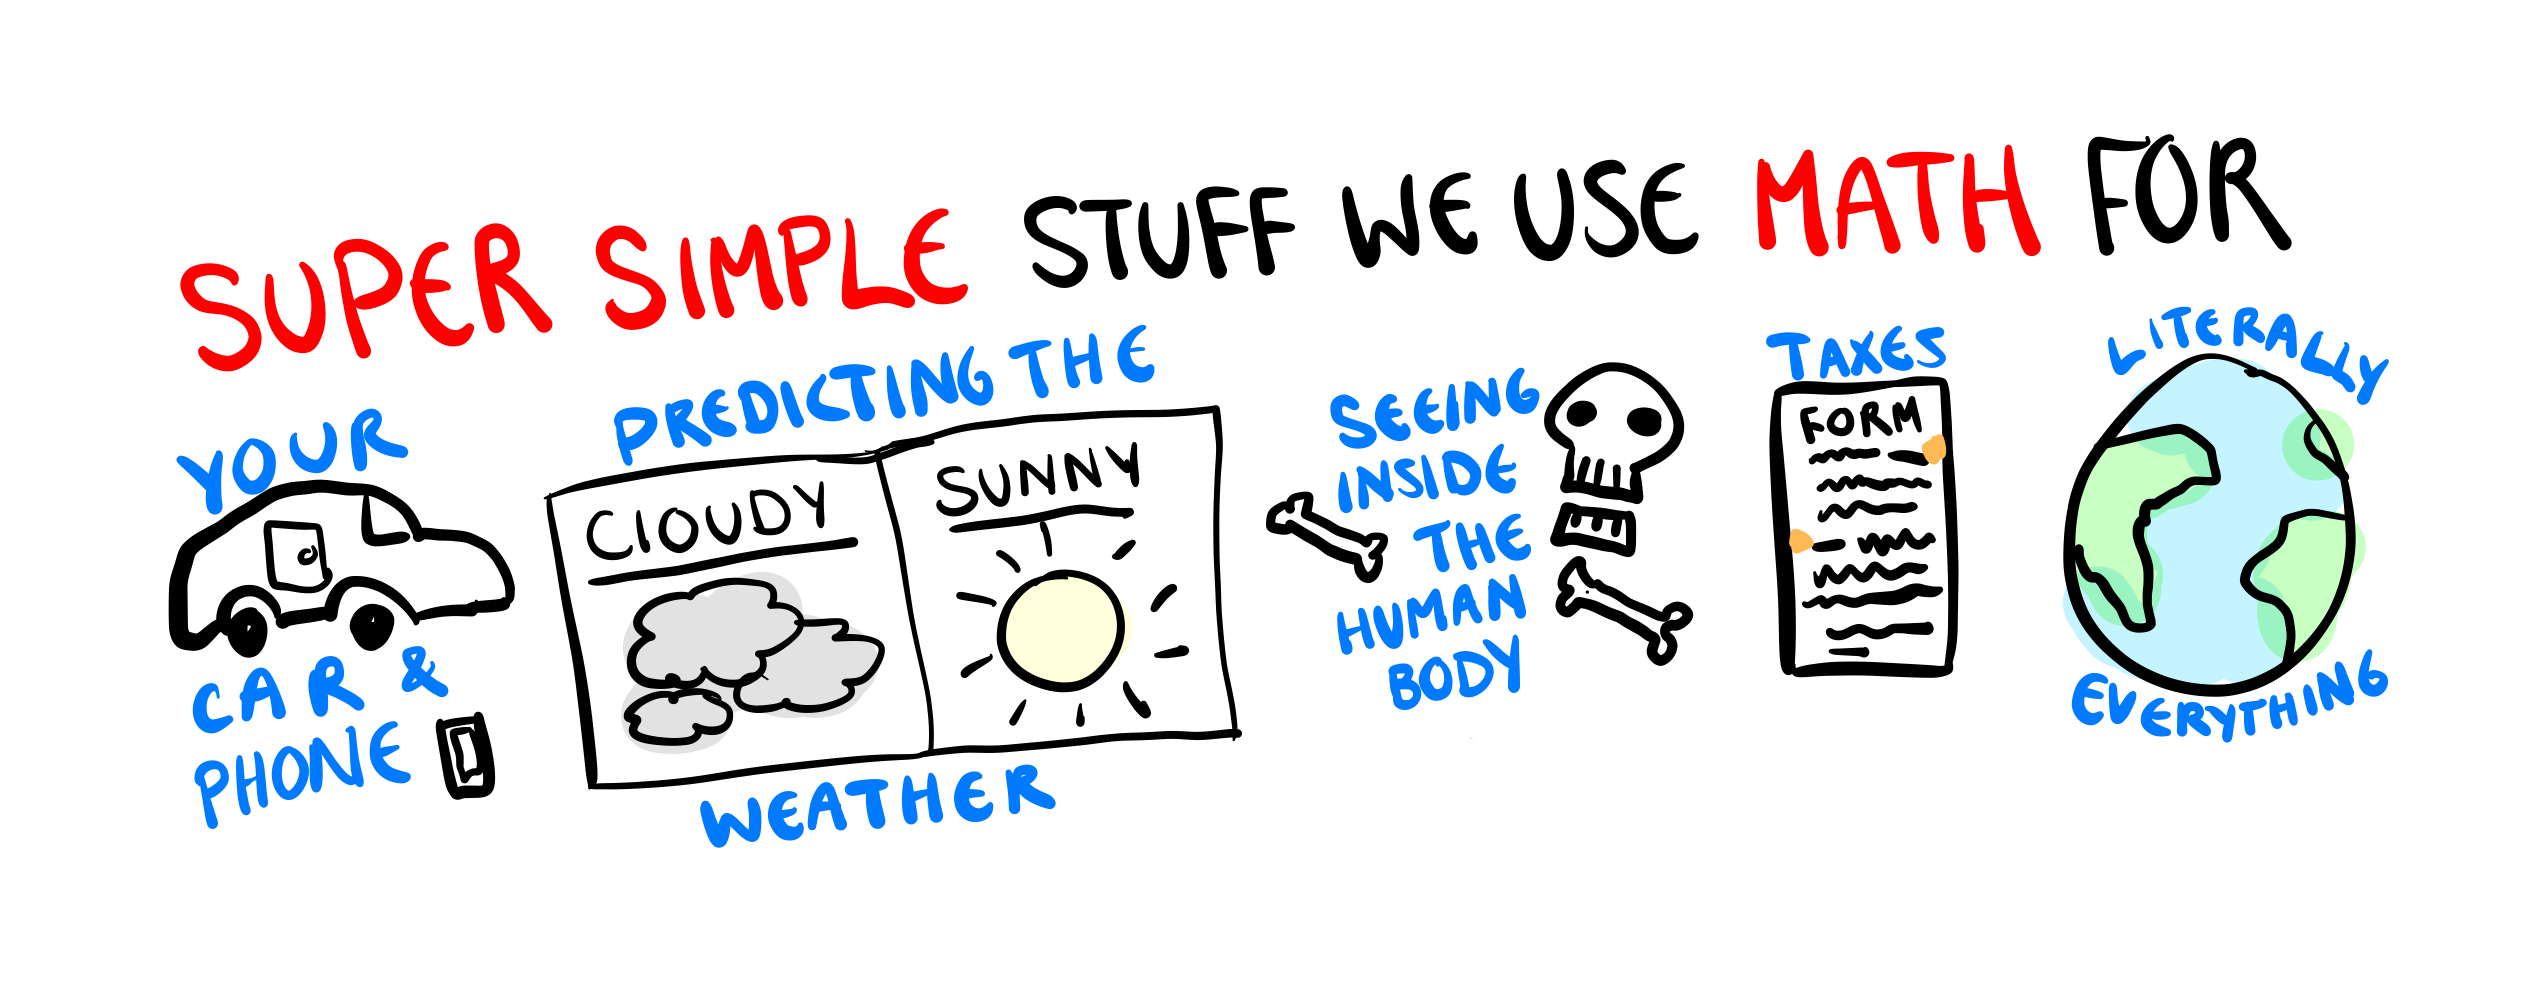
How does VIS view themselves as a field? Well, we can get a gist from this bluesky comment where I was told that “the correct project for VIS is not checking data formalisms against human interpretation, but building up models of how people read charts that combine those data formalisms with perceptual and cognitive operators”. One thing I find quite odd about this response is that it implies that math is some kind of limitation on the field that would reduce the number of testable theories. I mean, I would hardly describe the fields within the purview of math, such as the physics of the entire universe, predicting the weather, and describing the economy, to be simple or trivial research. The idea that computer graphics is the one field that is too complicated for math to capture feels a little absurd to me.
The second problem with this sentiment, is the animosity to the idea of limiting the scope of the VIS. I think a lot of VIS researchers see VIS as a melting pot of a field where they are coming up with a true “theory of visualisation” that can cover everything that visualisation touches. Therefore, the breadth of visualisation is a strength, after all it allows them to take the best ideas from multiple fields, including statistics, computer science, and human psychology.
The problem with this idea, is that it is a bit of a fantasy. Statistics involves mathematical rigor which, as the comment above shows, VIS researchers doesn’t adequately value. Mathematical rigor requires much more effort than hand waving taxonomies (trust me, I did both), so, on average, statisticians publish far fewer articles than a VIS researcher. When you make a field so broad that it involves everyone, people who do work that is tedious and time-consuming end up outnumbered and ejected from the community. This has shown to be anecdotally true, as I know several statisticians, who, like me, have tried to engage with the VIS community and correct some statistical mistakes, only to have their concerns shrugged off and treated as a “difference of opinion” rather than a self-evident statistical fact. This results in a community where statisticians are not incentivised to stay in VIS and often leave.
So, the openness of the field may not be the idealised fantasy, but at least it’s not hindering your research. I would actually argue that it is and it has led to a bit of a “statistics slop” problem in VIS.
2. It is lacking in mathematical rigor, experimental evidence, etc.
I rarely come across a formally trained statisticians in VIS, the vast majority of people doing “statistical graphics” in VIS are computer scientists who do not have sufficient statistical training. This is not a bad thing, I have seen people from all fields, including linguistics, biology, and music do great statistics research. The problem is that these people do statistics in a field of statisticians who can check the correctness of the work.
Unfortunately, this isn’t the case for VIS, which means that the vast majority of statistical reasoning in the field is what I would call “slop” statistics. This reasoning has the sheen of statistics, they use the language of statistics, but the statistical reasoning is completely incoherent and disconnected from how statistical theory or random variables work. Before I give some examples of what I am talking about, I want to make it clear that the authors of these papers are not to blame for this. As a matter of fact, to make this point clear, I want you to read the explanation as to why these papers have incorrect statistical logic and see if you, as a VIS researcher, would have clocked it. With that being said, here are some examples of the statistics issues I’m talking about:
First we have the MapLineup paper which seems to have been was entirely borne from the authors misunderstanding about the fact that a lineup protocols must has a random null plot with no structure. Actually a lineup can have any null distribution you want. I don’t understand why the authors seem to think that spatial autocorrelation in the null would require a different method. They do not provide any justification for this in the paper, but it has 75 citations, so clearly the VIS community feels that they didn’t need to.
Next we can look at this paper on missing value imputation which is visualising imputed missing random values, using things like confidence intervals or density plots. The authors say the confidence values are for the missing values themselves, but proper confidence intervals for a missing value (in this visual inference scenario) should look more like prediction intervals (which would be far wider than the intervals used in this visualisation). This makes me think that the intervals are capturing the sampling error in the imputed mean (which would be fine for model building) rather than the error in the value itself (which is what would be required for visual inference). Either that or the authors just simulated a random confidence interval, lol. Either way, the best approach for visualising missing values (and avoid all the confidence interval stuff all together) is probably to just use the “in the gutter” approach from the
naniarpackage.Another paper worth looking at is the value suppressing uncertainty palette paper which is a nice idea, where we blend colours together as they become more uncertain. The problem with this, is that really isn’t a sensible way to represent a distribution as a single colour, so there isn’t a statistically sensible way to blend the colours together. You could say it should align with some sort of hypothesis test, but hypothesis tests often don’t agree. For example, if we consider three values, each of them might pass a paired t-test, so they should be the same colour, but fail an f-test, indicating that they shouldn’t be the same colour. How do you set the scale such that this works? You can’t. This issue arises from the fact that this mean/variance approach is a fundamental mischaracterisation of what a random variable is.
These are not once-off examples, these are literally the first three papers that came up when I searched IEEE in my Zotero (it’s not well organised). These examples are also just symptoms of a much bigger issue, which is that an overwhelming amount of statistical reasoning in VIS is wrong. Expecting these authors to get the statistics right, when the literature they are learning from is itself incorrect, is not really a fair expectation.
These problems are not limited to statistical arguments either. Theoretical papers in VIS present ideas for how visualisations are made or used, but are often incredibly vague, and use their own bespoke terminology/symbols and are impossible to translate into the mathematical formalisation required to actually test it. The correctness of these papers seems to be based on how real they “feel”, with the epistemics of the area having more in common with a religion than a science. An example of one of these papers is the Nested Model for Visualisation. Because of this, the large majority of experimental work do not actually test these “theories” of VIS directly. Instead, they test:
- their own mathematical approximation of the vague theoretical concept, which is often translated differently by each researcher (for an example see the “decision making” literature)
- theories from other fields (such as vision science or statistics), or
- their own bespoke theory invented for the particular paper.
This leaves the empirical and theoretical work of VIS completely disconnected from one another. Ultimately, VIS is not left with many papers that offer a (correct) theoretical foundation that can be empirically tested.
4. The theories are not recognisable
The disconnect between the empirical and theoretical work at VIS often makes it feel like people are just taking turns saying stuff. However, VIS is not only disconnected from it’s own theories, it is also disconnected from the theories of other fields. I am not an expert in everything, so I can’t speak to every field, however, I am an expert in statistics.
This is all to say, some of the terminology and ideas used by the uncertainty visualisation community are somewhat bizarre. Many of the authors in uncetainty visualisation don’t really seem to know what uncertainty is (which makes their decision to research uncertainty visualisation a little odd if I’m going to be honest). Uncertainty is the by-product of inference, this is just a fact of statistics philosophy and a lot of science philosophy more broadly. Since uncertainty is the by-product of inference it is always connected to some inferential statistic. This means you need to be drawing inference on something for there to be any uncertainty. Additionally, the uncertainty is limited to that one statistic. However, a lot of uncertainty visualisations papers treat uncertainty as a vibe or something that erupted from a nebulous void (example). Alternatively they think that uncertainty distributions on different estimates are freely exchangeable (e.g. 1, 2). Or they are bizarrely specific and link the quantification of uncertainty to it’s visualisation approach (e.g. 1 and 2), even though they are completely independent statistical concepts and the uncertainty should never be quantified inside the visualisation.
There are also a lot of VIS papers that are clearly knocking on the door of some very foundational statistics theories, and they would benefit from the specificity that comes with adopting the norms of statistics. I would put the many papers that try to give some taxonomy or experiment for what is fundamentally the issue of. bias and variance in statistics (e.g. e.g.1, 2, and 3). There is also this recent bluesky thread which boils down to a discussion about the impact of the conflicting assumptions made by a plot designer and it’s viewer, an issue which has foundational work done in statistics through multi-phase inference.
My suggestions to be less (or more, no judgement here) crackpotty
So, to summarise these issues, VIS has a little bit of crackpottery going on. And look guys, I get it. I have done my fair share of crackpot research. But I do think its worthwhile to maybe evaluate the openness of the community, and ask yourself if it is always a good thing.
Ultimately, I think the VIS communities greatest strength is also its biggest weakness, and that is its openness to new ideas that are not (and may never be) fully formed or testable. This openness is what is causing the lack of rigor that has you people crashing out about the field being directionless (see e.g.1 and e.g.2). Like, you can’t be desperate for rigor, and then be hostile to rigor itself. Ultimately, you either need to:
- Stop being so loosy-goosy with what you consider to be research, and start asking for proper mathematically defined theories, or
- Fully lean into the openness of everything and anything being research and stop being mad that your literature isn’t as cohesive as that of a hard science
If you want to stop being so loosy goosy, then you need to start formalising your ideas in statistics (for all data visualisations) and information theory (for everything else). You might think this is limiting, but I must remind you: data visualisations are literally a summary of data, they are therefore statistics, and their information theory falls under the purview of statistics.
Acting as though this formal theory this would ruin the field is, in my opinion, a little overdramatic. Like, “fields that have a mathematically defined theory that they test” is basically all of science, including fields like physics, economics, and meteorology. Its not even the bad stuff, really clever experiments are some of the best thing science had to offer. I’m not even saying you can’t do both the theory and the experiment. The theory just needs to be sent to a venue that has the expertise to assess it. If this blog post is evidence of anything, it is evidence that the VIS community clearly cannot be trusted to do their own statistics (no offence).
Or don’t, and just keep doing what you guys are doing. I don’t really care. We all do a little crackpot science.